© 2026 ALLCITY Network Inc.
All rights reserved.


It has been 12 years since the Diamondbacks last traveled to Milwaukee to face the Brewers in the first round of the playoffs.
At that time, only one wild card team made it from each league, and the Wild Card Series did not exist. The postseason started with all eight teams playing in the five-game National League Division Series.
For the Diamondbacks, Milwaukee was a formidable foe. The Brewers won 96 games in 2011; the Diamondbacks, 94. Milwaukee had home-field advantage after posting the best regular-season home record in the majors that year at 57-24.

The Diamondbacks dropped the first two games in Milwaukee before responding with two wins of their own back home. The series ultimately came down to a a Nyjer Morgan RBI single in the 10th inning of Game 5 off D-backs closer J.J. Putz. The D-backs went 0-for-3 in trying to win a playoff game at what was then known as Miller Park (now American Family Field).
This time around, the format is not as forgiving. If the D-backs begin the postseason by losing two games in Milwaukee, that is where it will end. They won’t have a chance to return home to right the ship.
At the same time, they have very little to lose. Few expected them to get here in the first pace, and few expect them to advance far now that they are.
Even so, there seems to be an industry consensus that the Brewers were the opponent of choice in the Wild Card Series, as opposed to the reigning National League champion Philadelphia Phillies.
In light of that, the Diamondbacks might have aided their fortunes by dropping from the fifth to the sixth NL playoff seed in the final days of the season and landing a date in Milwaukee, not Philadelphia, in the process. The Diamondbacks went 4-2 against the Brewers in the regular season.
Make no mistake, though: Overall, the Brewers were much better than the Diamondbacks in the regular season. Still, that does not mean they were better at everything, nor that they are unbeatable. Let’s take a look at how the two teams stack up.
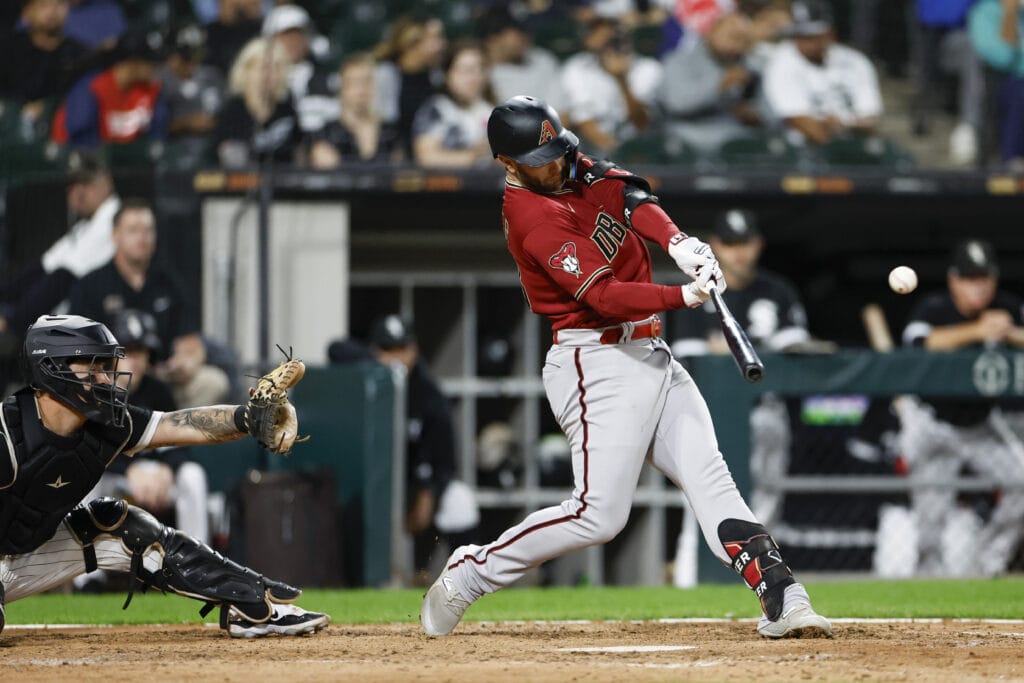
Hitting: Advantage Diamondbacks
As late as June 27 — roughly the halfway point of the season — the Diamondbacks had outscored the Brewers by over 100 runs (101, to be exact). At that point, Arizona averaged 5.2 runs per game while the Brewers averaged four runs per game. The Diamondbacks’ offense seemed to be significantly better.
Then, from June 28 on, the Brewers outscored the Diamondbacks by 83 runs, finishing the year with only 18 fewer runs scored than Arizona. Ultimately, these offenses are fairly evenly matched, but the Diamondbacks has been slightly better.
Take a stat like weighted runs created plus (wRC+), for instance. The Diamondbacks finished the season with a 98 wRC+ (100 is league average) compared to the Brewers’ 92.
If we look at the actual players in each lineup, the D-backs’ group seems to come out on top. Arizona’s three best hitters — Corbin Carroll (133 wRC+), Ketel Marte (127 wRC+) and Christian Walker (120 wRC+) — compare favorably to the Brewers’ best three: William Contreras (125 wRC+), Christian Yelich (121 wRC+) and Mark Canha (120 wRC+).
After that, the Diamondbacks have slightly better depth, with Lourdes Gurriel Jr., Gabriel Moreno, Geraldo Perdomo and Tommy Pham all logging wRC+’s of 100 or higher in the regular season. On the Brewers side, that could be said only of Garrett Mitchell, who has played in just 18 games, and Carlos Santana. (Tyrone Taylor warrants a mention here as well; he had an 88 wRC+ this year, but a much-improved 126 mark after the All-Star break.)
As alluded to earlier, the Brewers have been the better offensive team in the second half and even more so recently. In September, Milwaukee amassed a 106 wRC+ as a team compared to the D-backs’ 86. The Brewers scored roughly one more run per game on average than the Diamondbacks did in the month.
Based on the season stats, we’ll still call this one advantage Diamondbacks. But it’s really close.
starting pitching: Advantage Brewers
The Brewers have the better starting rotation, and, at first glance, it is not particularly close. Milwaukee’s starters ranked sixth in the majors in the regular season with a 3.96 ERA. Diamondbacks starters ranked 21st with a 4.65 ERA.
It is important to keep in mind, however, that this is only a three-game series, and the Diamondbacks’ glaring lack of starting pitcher depth will not be as much of a factor here as it was during the regular season.
To get a better feel for how each side’s starting pitching compares in this series, we ought to look at the actual expected pitching matchups:
- Game 1: Brandon Pfaadt vs. Corbin Burnes
- Game 2: Zac Gallen vs. Brandon Woodruff
- Game 3 (if necessary): Merrill Kelly vs. Freddy Peralta
All three Brewers pitchers listed have pitched like frontline starters when healthy. The same could be said for the Diamondbacks’ Gallen and Kelly, but the team is putting considerable trust in Pfaadt, a rookie with a 5.72 ERA, in Game 1.
Pfaadt pitched better in the second half of the year, though. Since moving to the first-base side of the rubber prior to being recalled on July 22, he has an easier-to-stomach 4.22 ERA in 13 appearances (12 starts).
On the Brewers’ side, Burnes has actually pitched better in the second half as well.
Here is a look at how their numbers compare since the All-Star break:
| Pitcher | IP | ERA | WHIP | K/9 | BB/9 | HR/9 | FIP |
| Brandon Pfaadt | 70.1 | 4.22 | 1.24 | 9.3 | 2.1 | 1.7 | 4.35 |
| Corbin Burnes | 86.1 | 2.71 | 0.98 | 10.2 | 2.8 | 0.8 | 3.27 |
Of course, the Brewers have the upper hand here.
The 28-year-old Burnes has made two starts against the Diamondacks this year, one on April 11 at Chase Field and the other on June 19 at American Family Field in Milwaukee. In the former, he tossed eight scoreless innings with eight strikeouts. In the latter, he was tagged for seven runs on eight hits over five innings.
Pfaadt has yet to pitch against the Brewers in his major league career.
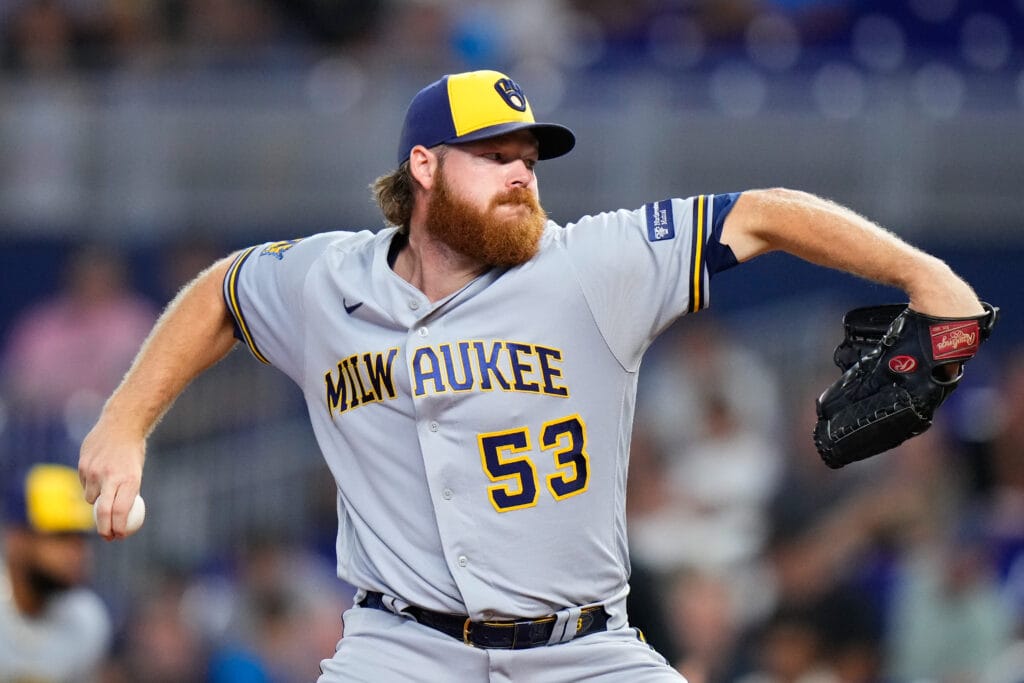
Brewers starter Brandon Woodruff, who lines up to start Game 2 for Milwaukee, missed most of the 2023 season with a right shoulder injury. Since returning from the injured list on Aug. 6, however, he has been his usual dominant self.
Here is a look at how Woodruff’s numbers for the year compare with those of the Diamondbacks’ projected Game 2 starter, Zac Gallen:
| Pitcher | IP | ERA | WHIP | K/9 | BB/9 | HR/9 | FIP |
| Zac Gallen | 210 | 3.47 | 1.12 | 9.4 | 2.0 | 0.9 | 3.27 |
| Brandon Woodruff | 67 | 2.28 | 0.82 | 9.9 | 2.0 | 1.2 | 3.60 |
Woodruff has not faced the Diamondbacks this year, but he pitch against Arizona twice last season. On Sep. 1, 2022, he gave up five runs on eight hits in 5 2/3 innings against the D-backs at Chase Field. On Oct. 3, 2022, he turned things around, tossing six innings of two-run ball with only two hits allowed and seven strikeouts at home in Milwaukee.
Gallen has had two dominant outings against the Brewers this year. On April 10, he tossed seven scoreless innings with 11 strikeouts against them at Chase Field. On June 21, he allowed only one run on three hits in seven innings.
Suffice it to say that both Gallen and Woodruff are fantastic pitchers. Neither team has a clear starting pitcher advantage in Game 2.
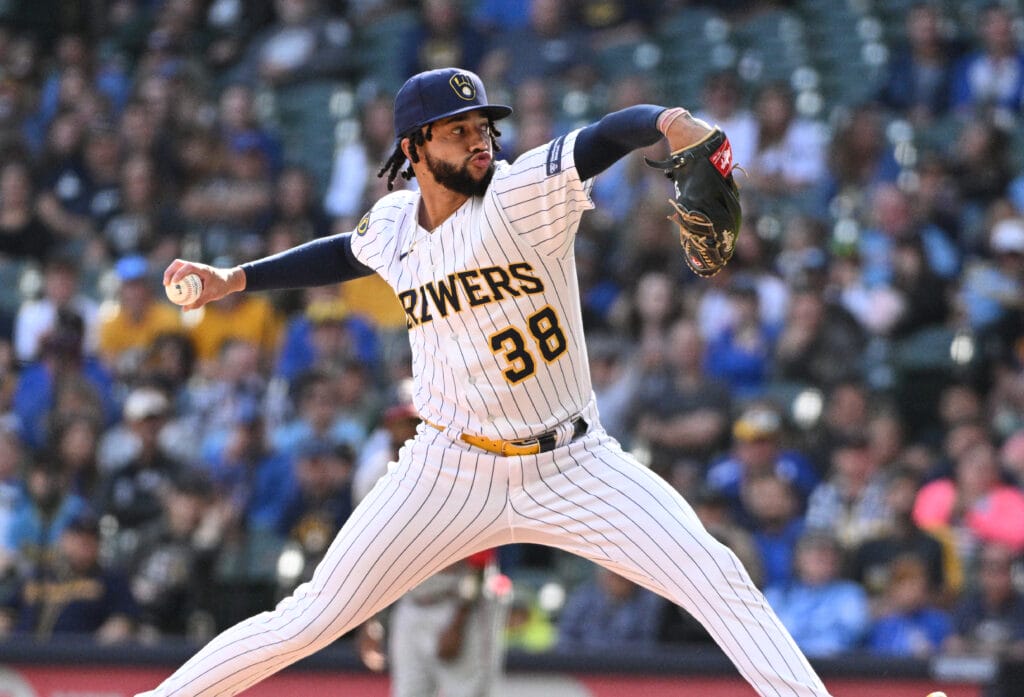
If Game 3 is necessary, it seems likely that Diamondbacks righty Merrill Kelly would face Brewers righty Freddy Peralta.
Here is a look at how their stats compare this season:
| Pitcher | IP | ERA | WHIP | K/9 | BB/9 | HR/9 | FIP |
| Merrill Kelly | 177.2 | 3.29 | 1.19 | 9.5 | 3.5 | 1.0 | 3.85 |
| Freddy Peralta | 165.2 | 3.86 | 1.12 | 11.4 | 2.9 | 1.4 | 3.85 |
Peralta finished the regular season particularly well for Milwaukee, going 6-2 with a 2.44 ERA, 0.85 WHIP and an eye-popping 92 strikeouts compared to just 11 walks in 62 2/3 innings.
His fastball velocity has waned slightly as the season has progressed, but Peralta has pitched well anyway.
As with the Gallen-Woodruff matchup, it is difficult to make a case for either Kelly or Peralta as the better pitcher here. It is worth noting, however, that Peralta has a 3.44 ERA at home while Kelly has a 4.07 ERA on the road. That could be enough to swing this in Milwaukee’s favor, on paper.
Ultimately, the Diamondbacks do not have a clear starting pitcher advantage in any of the three games against the Brewers. Few major league teams would. But with Gallen, Kelly and an improving Pfaadt lined up, the Diamondbacks’ slate of starters in this series is better than their starting staff’s season ERA would have you believe.
Relief Pitching: Advantage Brewers
The fact that Diamondbacks relievers finished the 2023 season with a combined 4.18 ERA, the 18th-best mark in baseball, is no small development. It was a big step forward from last year’s 4.55 bullpen ERA, and one of the main reasons the team has gotten to this point. This Brewers’ bullpen is one of the best in baseball, however.
Milwaukee has four relievers with 50 or more innings pitched and ERAs under 2.60. All of them — Devin Williams, Hoby Milner, Joel Payamps and Bryse Wilson — are healthy and ready to go for the playoffs.
In addition to that group, Elvis Peguero posted a 3.38 ERA in 61 1/3 innings in the regular season this year. Trevor Megill had a 3.31 ERA in 32 2/3 innings. Rookie Abner Uribe managed a 1.76 ERA in 30 2/3 innings. This Milwaukee bullpen not only has an elite closer in Williams, a lockdown lefty in Milner, but impressive depth to back them up.
To be fair, while the Brewers’ bullpen has far outperformed the Diamondbacks’ over the course of the season, Arizona’s finished the year on a slightly higher note. In September, D-backs relievers posted a 2.16 ERA, good for the second-best mark in baseball. The Brewers were right behind them at 2.24.
Much of the D-backs’ bullpen success in September was because of veteran righty Ryan Thompson and lefty prospect Andrew Saalfrank, a pair of late-season additions who allowed only one combined earned run combined in 22 2/3 innings to finish the season.
With those two in the fold, Kevin Ginkel coming off a career year and Paul Sewald continuing to solidify the ninth inning, this is the best the Diamondbacks’ bullpen has looked all year. Still, that Milwaukee ‘pen is nasty.
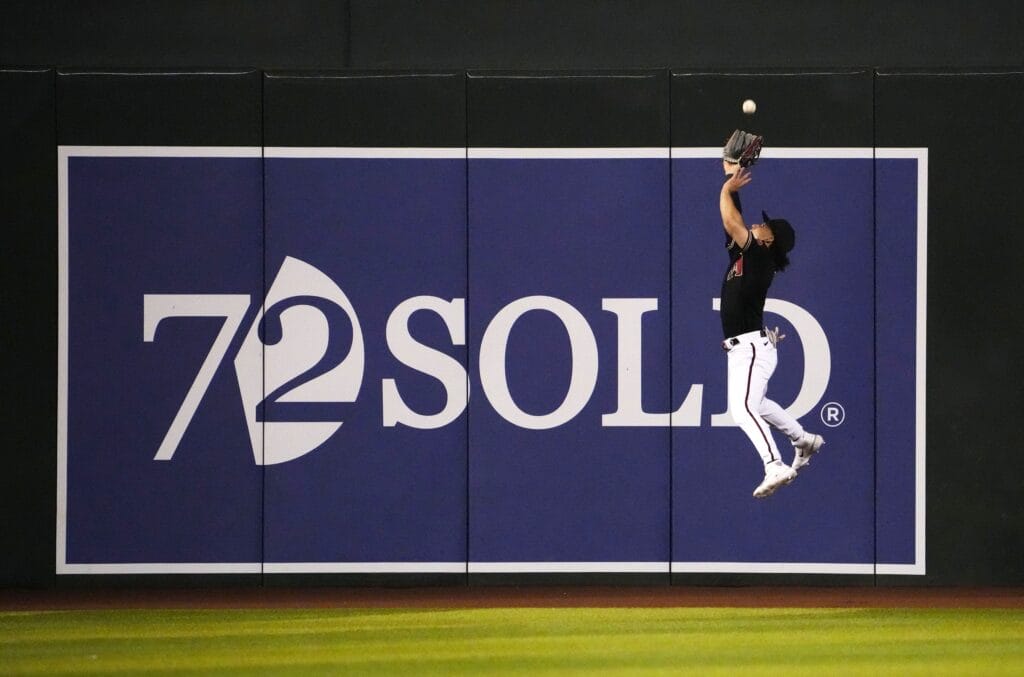
Defense: Advantage Brewers
Only one team in baseball has more defensive runs saved and outs above average than the Diamondbacks. That would be the Milwaukee Brewers.
The Diamondbacks finished the year with 48 DRS and 32 OAA as a team compared to the Brewers’ 68 and 40, respectively.
The Diamondbacks have an elite center fielder in Alek Thomas, an elite catcher in Gabriel Moreno and an elite first baseman in Christian Walker. The Brewers have an elite middle infield with Willy Adames and Brice Turang and solid defenders all across the diamond.
If you like defense, you will enjoy watching the Diamondbacks play the Brewers.
Baserunning: Advantage Diamondbacks
No team gets more value from stolen bases — both stealing them and preventing them — than the Diamondbacks.
The Diamondbacks not only lead all major league teams in Fangraphs’ Stolen Bases and Caught Stealing runs above average metric, but they have accumulated nearly twice as many as the next closest team.
Explaining that is rather straightforward. The Diamondbacks have arguably the best players in the sport on both sides of that equation: Corbin Carroll and Gabriel Moreno.
Carroll led the majors in baserunning runs above average this year. He went 54-for-59 in stolen base attempts, a 91.5 percent sucess rate.
Moreno led the majors in stolen base runs saved above average. He caught 22 of 57, or 38.6 percent, of attempting base stealers.
The Brewers ranked 15th in baserunning runs above average, and are a perfectly fine team in the bases. Their 127 stolen bases ranked 11th in the majors.
Almost half of those came from either Yelich or Turang; together, they combined for 53. Contreras, Canha and Tyrone Taylor take off every now and then, too.
As far as preventing base stealing is concerned, both Contreras and backup catcher Victor Caratini grade out below average in that regard. Together, they have caught only 23 of 144, or 16 percent, of attempting base stealers.
The Diamondbacks do not have many clear advantages over the Brewers, but their ability to wreak havoc on the bases is one of them. Expect them to be aggressive on that front.
Follow Jesse Friedman on X (formerly Twitter)
Top photo: Benny Sieu/USA TODAY Sports
Get Arizona's Best Sports Content In Your Inbox!Become a smarter Arizona sports fan with the latest game recaps, analysis and exclusive content from PHNX's writers and podcasters!
Just drop your email below!
Comments
Share your thoughts
Join the conversation
The Comment section is only for diehard members
Scroll to next article
Don't like ads?
Don't like ads?
