© 2026 ALLCITY Network Inc.
All rights reserved.

Every year around this time, as Cy Young races heat up, baseball junkies once again stir up countless debates over which pitching stats matter most.
There is a sense in which ERA is still king, but perhaps not in the way that it was 20 — or even 10 — years ago. Other pitching stats like innings, strikeouts, walks, WHIP, wins above replacement, opponent batting average and wins — yes, wins — all matter to some degree.
As such discussions take place, it is important to remember: The discourse among fans and analysts on this topic is not necessarily in tune with that which takes place in actual major league clubhouses. The gap, in fact, could be the largest it has ever been.
Under that premise, I asked Diamondbacks pitchers a simple question: Which season pitching stats matter most to you personally?
To be clear, this is not simply a what-would-you-do-with-a-Cy-Young-ballot question. Answers could depend a pitcher’s role, whether starter or reliever, as well as his strengths and weaknesses.
For some, strikeouts are a key barometer of success. For others, limiting walks is a point of emphasis. And, still, for others, xwOBACON is a key metric. Bacon? That can’t be a real stat, right?
As one would imagine, the appetite for advanced pitching stats varies widely in major league clubhouses.
I asked former Diamondbacks reliever Andrew Chafin before he was traded to the Milwaukee Brewers at the deadline. “Goose eggs,” he said. “Don’t let any runs score.”
It turns out that being really freaking good at baseball does not come with the prerequisite of understanding the latest stats churned out by baseball’s Ivy League scholars. There is a reason why some of us get paid to write and talk about this sport, not play it.
Without further ado, here is what 10 Diamondbacks pitchers had to say. For each of them, the first stat in bold (two stats, in some cases) is the pitcher’s primary choice. Any other top choices are listed separately, also in bold.
Yes, ERA makes its fair share of appearances, but there are some fun surprises along the way.

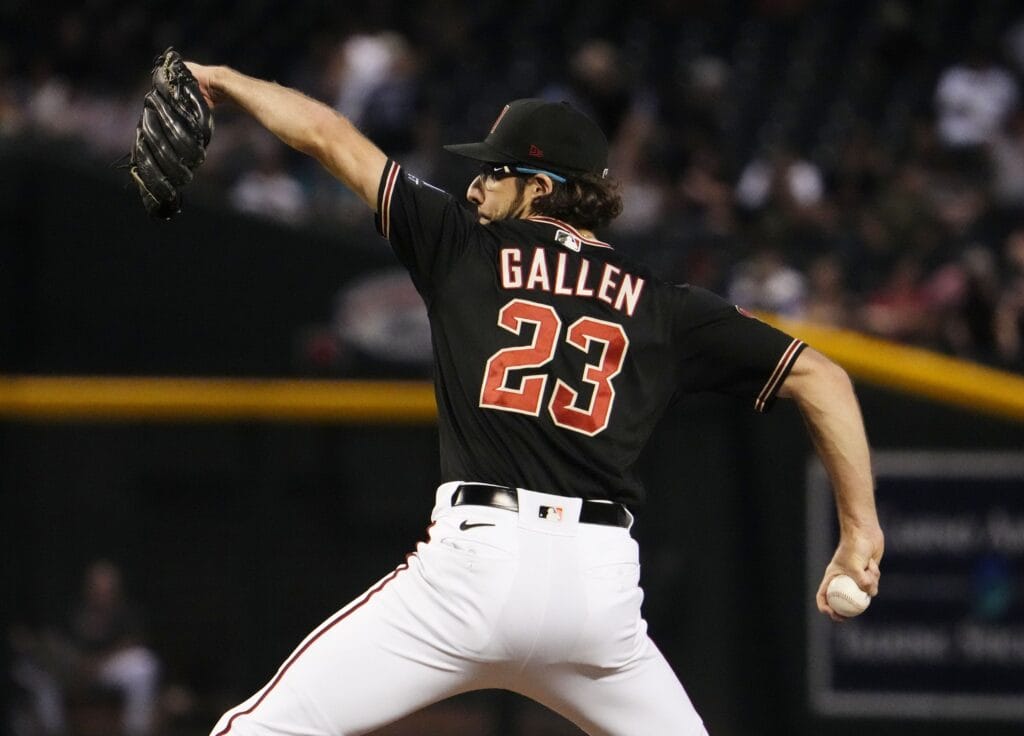
Zac Gallen
ERA
Diamondbacks ace Zac Gallen gave the answer that I expected most, if not all, to give: good ol’ ERA. It is not hard to see where he is coming from.
“As clouded as some people say ERA is,” Gallen said, “ultimately, you have to eliminate runs.”
Other top choices: WHIP, wins
Gallen said that WHIP, along with some of its underlying components, is a secondary option.
“Hits per nine, walks per nine, just stuff like that,” he said. “If you’re going to give up a homer, you’re giving up a double, whatever, just make sure that there’s not much traffic on base.”
Gallen also said that wins are “solid.”
“This day and age,” he said, “you can pitch yourself into a win because you’re not going nine innings anymore.”
(Ironically, Gallen actually did pitch nine innings in a start shortly after he said this, doing so for the first time in his career on Sep. 8 against the Chicago Cubs.)

Merrill Kelly
Innings pitched
It is no secret that Merrill Kelly prides himself on being an innings-eater. This was made especially clear last year when he was hellbent on reaching 200 innings. (He finished the year with 200 1/3.)
For Kelly, innings pitched is something of an all-encompassing stat; if he is throwing a lot of innings, he is probably doing everything else well, too.
“If you look at all the guys that have a ton of innings at the end of the year, [they] probably had a really good year, right? Like, there’s probably not too many guys out there that throw close to 200 innings and have a 5.00 ERA.
“If you’re going deep into games, then the games are usually going pretty well.”
Other top choice: WHIP
“[WHIP] shows just how dominant a pitcher can be,” Kelly said.
Much like innings pitched, a good WHIP for Kelly is a sign of a lot of other things.
“That just tells me that not only are you not walking guys, but you’re in the zone so much and guys still can’t do anything with it. That shows how effective you are, not only how well you can command the ball, but also how good your stuff is.”

Brandon Pfaadt
ERA
While ERA is Brandon Pfaadt’s top choice, suffice it to say that he would not classify himself as a stat-head. “I’ve never really looked at stats my whole career,” he said.
“It’s kind of a rabbit hole to look at. Even when they’re not good, like now, it’s like, kind of disregard it and just go to the next game. That’s kind of how I’m taking it. I don’t really care about my stats. I’m just here to help the team win.”
Other top choice: Strikeouts per start
Pfaadt said that he does look at strikeouts from time to time. He cautioned, though, that he does not put much stock in what he sees.
“I don’t even care about those,” he said. “I care about if I gave my team a chance to win, if I helped by going deeper into the game.”

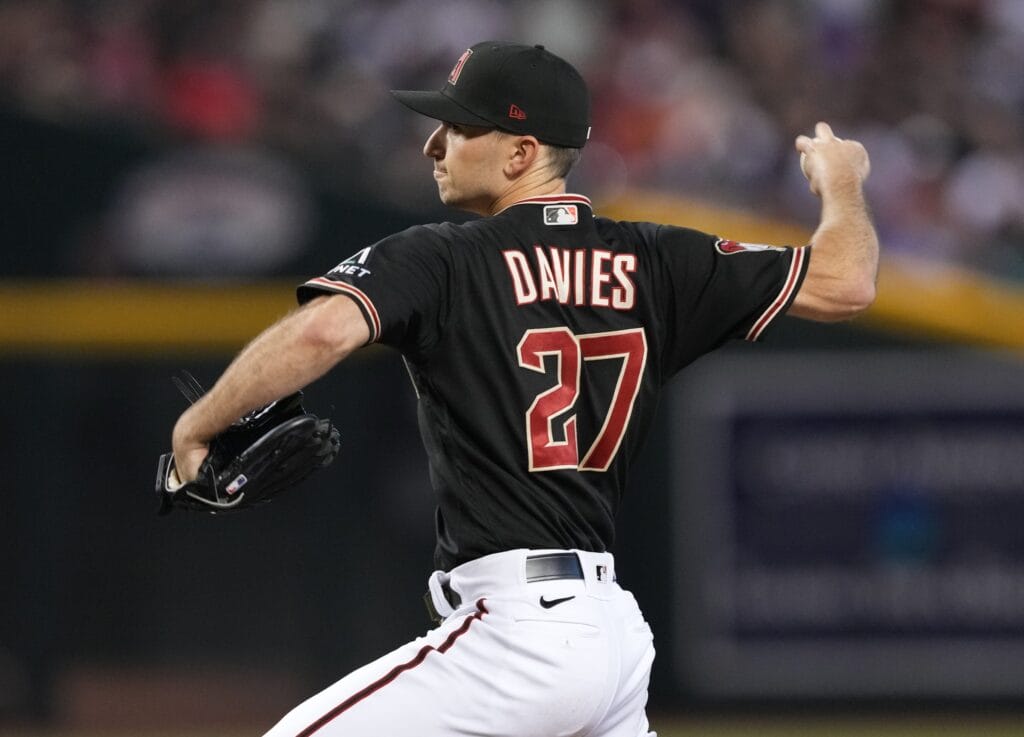
Zach Davies
Innings pitched
Zach Davies’ perspective on innings is quite similar to that of Kelly.
“If you have a full season’s worth of things,” Davies said, “you know you’re healthy, you know that you’re pitching well enough to pitch deeper into games.”
Injuries have kept Davies from accumulating a full season’s worth of innings this year. He has missed a total of about three months with oblique and back injuries.
Lately, manager Torey Lovullo has held most of his starters, including Davies, to relatively low pitch counts.
In situations where he might be on a shorter leash, Davies said that he shifts his focus to “overall performance.” It’s about limiting damage and keeping his team in the game as best he can.

Ryne Nelson
ERA
For Ryne Nelson, it is not complicated. “The less runs you give up,” he said, “the better.”
Other top choice: Innings pitched
“This year,” Nelson said, “the main focus for me has been getting deep into games and trying to eat some innings.”
Nelson has struggled to induce enough swing-and-miss in 2023, but he has also recognized that pitching to contact can help him get deeper into games.
“If I can get a guy to break his bat on a fastball first pitch,” he said, “I’ll take that over a five-pitch strikeout.”

Paul Sewald
0-0 strike percentage and 1-1 strike percentage
Few pitchers are more passionate about stats than newly acquired Diamondbacks closer Paul Sewald.
For him, the most important stats are 0-0 strike percentage (also known as first-pitch strike percentage) and 1-1 strike percentage (percentage of 1-1 pitches that are strikes).
It is not hard to see why those metrics would be important for pitcher success. It is well-documented that the difference between an 0-1 and a 1-0 count is significant, as is the difference between a 1-2 and a 2-1 count.
During his time with the Seattle Mariners, Sewald saw how powerful an emphasis on these stats could be.
“That’s what transformed the worst pitching staff in baseball to one of the best pitching staffs in baseball,” he said. “That’s literally the only thing we talked about the whole three years I was there, and the results spoke for themselves across the board.
“It seems elementary, but it is the important thing. We get so caught up in spin rate and, like, make your pitch do this. Throw strikes instead of balls and see what happens.”
Non-coincidentally, the Mariners rank first in the majors this year in both 0-0 strike percentage and 1-1 percentage. (Mariners starters Logan Gilbert and George Kirby appear to be gods in this respect.)
While there is good reason to believe that Sewald’s stuff is better than it looks on paper, his low-90s velocity is atypical for a closer. Throwing strikes is important for his success.
It is no secret that Sewald has not been quite the same pitcher since coming over to the Diamondbacks. The difference can be seen in his 0-0 strike and 1-1 strike percentages:
| With Mariners | With Diamondbacks | |
| 0-0 Strike% | 64.9 | 63.2 |
| 1-1 Strike% | 70.5 | 65.6 |
As shown, Sewald’s 0-0 strike percentage has decreased from 64.9 percent to 63.2 percent since joining the D-backs. League average this year is 61.6 percent.
Similarly, Sewald’s 1-1 strike percentage decreased from 70.5 percent with the Mariners to 65.6 percent after being traded to the Diamondbacks. League average is 65.2 percent.
For your amusement, here is a look at where every D-backs pitcher on the active roster stacks up in 0-0 strike percentage:
| Pitcher | 0-0 Strikes | 0-0 Pitches | 0-0 Strike% |
| Kyle Nelson | 160 | 224 | 71.4 |
| Ryan Thompson | 20 | 30 | 66.7 |
| Zac Gallen | 531 | 798 | 66.5 |
| Joe Mantiply | 94 | 143 | 65.7 |
| Kevin Ginkel | 150 | 237 | 63.3 |
| Paul Sewald | 48 | 76 | 63.2 |
| Brandon Pfaadt | 237 | 376 | 63.0 |
| Ryne Nelson | 371 | 598 | 62.0 |
| League average | – | – | 61.6 |
| Merrill Kelly | 410 | 674 | 60.8 |
| Luis Frías | 71 | 119 | 59.7 |
| Miguel Castro | 145 | 252 | 57.5 |
| Andrew Saalfrank | 17 | 30 | 56.7 |
| Zach Davies | 203 | 359 | 56.5 |
| Bryce Jarvis | 35 | 68 | 51.5 |
And here is a look at where active D-backs pitchers stand in 1-1 strike percentage:
| Pitcher | 1-1 Strikes | 1-1 Pitches | 1-1 Strike% |
| Ryan Thompson | 6 | 7 | 85.7 |
| Kyle Nelson | 57 | 81 | 70.4 |
| Merrill Kelly | 168 | 241 | 69.7 |
| Brandon Pfaadt | 111 | 160 | 69.4 |
| Luis Frías | 29 | 42 | 69.0 |
| Zac Gallen | 213 | 313 | 68.1 |
| Kevin Ginkel | 75 | 111 | 67.6 |
| Ryne Nelson | 153 | 233 | 65.7 |
| Paul Sewald | 21 | 32 | 65.6 |
| League average | – | – | 65.2 |
| Zach Davies | 96 | 149 | 64.4 |
| Joe Mantiply | 36 | 56 | 64.3 |
| Andrew Saalfrank | 7 | 11 | 63.6 |
| Bryce Jarvis | 19 | 32 | 59.4 |
| Miguel Castro | 41 | 85 | 48.2 |
Generally, it does indeed hold true that most of the Diamondbacks’ better pitchers can be found near the top of both lists.
Said Sewald: “When you start looking at baseball through the through that lens, you’ll be shocked to see how successful and unsuccessful you can be when you go on either side of that.”
As a team, the Diamondbacks rank 18th in baseball in both 0-0 strike percentage and 1-1 strike percentage.
Other top choices: K-BB%, FIP, WHIP, xwOBACON
Given how slowly relief pitchers accumulate innings over the course of a season and how quickly ERAs can change with one bad outing, relief pitchers are perhaps the most difficult baseball players to evaluate.
“ERA for relievers is totally ridiculous,” Sewald said.
As an alternative, the D-backs’ closer proposed these six stats to be shown on the big board for relievers: 0-0 strike percentage, 1-1 strike percentage, strikeout minus walk rate (K-BB%), FIP, WHIP and expected weighted-on-base average on contact (also known as expected wOBACON or, more simply, xwOBACON).
There are a couple of unique ones here: K-BB% and xwOBACON.
K-BB% is the difference of a pitcher’s strikeout and walk rates. For example, Sewald has a 31.8 percent strikeout rate this year and a 9.8 percent walk rate. That means that his K-BB% is 22 percent. Obviously, strikeouts are generally good and walks are generally bad, so the higher this number, the better.
The league average strikeout rate in 2023 is 22.7 percent and the league average walk rate is 8.6 percent. Thus, the league average K-BB% is 14.1 percent.
Sewald is hardly alone in his reverence for this stat. Fantasy baseball analysts have found it be one of the most helpful stats for predicting pitcher success.
Expected wOBACON, or xwOBACON, measures quality of contact. It is similar to the more widely known xwOBA, but it only takes into account batted balls.
xwOBACON reads like an on-base percentage, but it runs higher than a typical on-base percentage because strikeouts and walks are not considered. The league average is .376. For a pitcher, the lower the number, the better.
“Go look at the list of expected wOBACON leaders in baseball,” Sewald said, “Those are the best pitchers in baseball. If you look at ERA, that is not the answer. Especially as a reliever, it doesn’t make any sense.”
Sure enough, the xwOBACON leaderboard for pitchers with 2,000 or more pitches thrown this year is impressive: 1) Corbin Burnes, 2) Pablo López, 3) Nathan Eovaldi, 4) Zach Eflin, 5) Marcus Stroman. These pitchers are not necessarily strikeout artists, but they are excellent at limiting hard contact. That’s what xwOBACON is all about.
Sewald’s xwOBACON for the season is an excellent .331, but it was just .288 with the Mariners and has skyrocketed to .419 since he was traded to the Diamondbacks.
In order to popularize stats like xwOBACON, K-BB% and others, Sewald emphasized the importance of giving fans points of reference.
“We have to start putting this stuff on the scoreboard,” he said, “and we have to start putting next to it the averages, like what’s average, what’s above average, what’s below average. Because people don’t get it. They know batting average. They’ve known it because it’s been the same thing for 150 years.”

Kevin Ginkel
WHIP
For Kevin Ginkel, maintaining a low WHIP is not just about keeping runners off the bases. It changes his mentality on the mound.
“Less traffic gives me more freedom to pitch how I want,” he said.
Other top choice: FIP
As a secondary option, Ginkel mentioned the increasingly popular FIP (fielding independent pitching). He said that it shows “how real your numbers are.”
He also talked about how it is especially important for relievers.
“Our numbers can get swayed big time because, [if] you come out of a game and runners are on base, your runs get cashed and that changes your ERA for the season.”

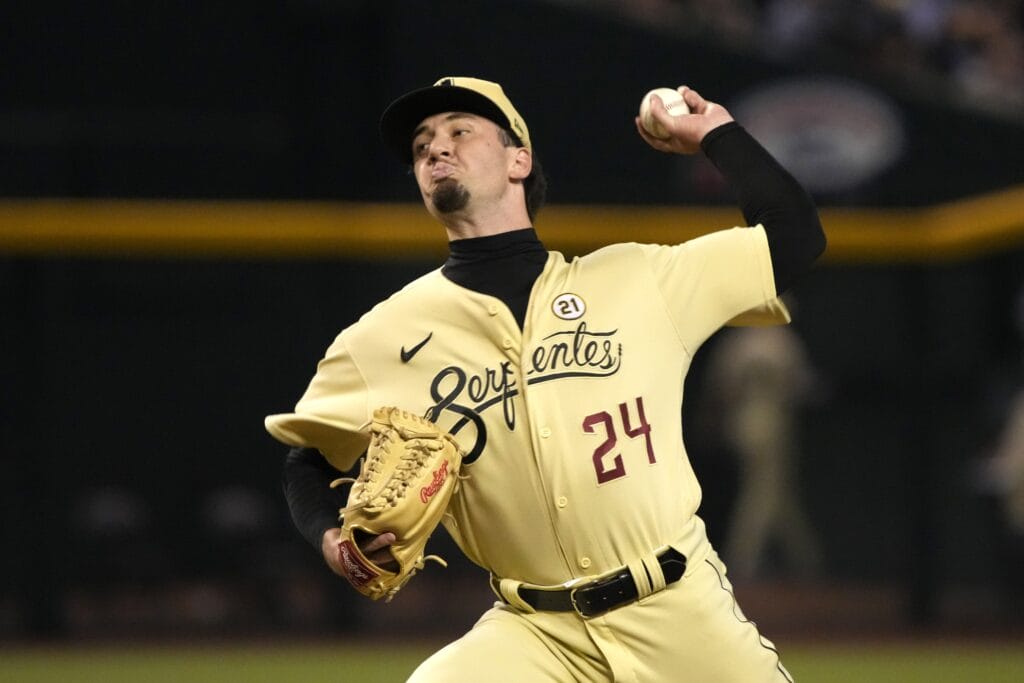
Kyle Nelson
ERA
Most baseball opinion-havers are aware that ERA is not a perfect stat, particularly for relievers. But Kyle Nelson talked about how it is still the primary number by which pitchers are evaluated.
“I think every pitcher would always want to have the lowest ERA they could have possibly,” he said. “That’s the one that gets attached to your name.”
Other top choices: WHIP, K/BB
Similar to Sewald’s K-BB%, strikeout-to-walk ratio (K/BB) is calculated by dividing a pitcher’s strikeout total by his walk total. The league average strikeout-to-walk ratio this year is 2.6.
Nelson’s is an excellent 5.0. He is one of just eight relievers in baseball with 50 or more innings pitched and a strikeout-to-walk ratio of 5.0 or higher.
For Nelson, strikeout-to-walk ratio is a strong indicator of command.
“It’s hard to get strikeouts without throwing pitches out of the strike zone,” he said. “If you chase strikeouts and throw a lot of pitches out of the zone, it usually leads to more walks. So, if you’re keeping the walks low and the strikeouts high, it means you’re throwing good pitches in the strike zone.”

Joe Mantiply
Inherited runners
“That’s just something that I take a lot of pride in,” Joe Mantiply said, “When I come in with somebody else’s runners on base, making sure they don’t score.”
Mantiply has been quite good in that regard this year. Of the 16 baserunners that he has inherited, only four have scored. That works out to an inherited score percentage of 25 percent, which is tied with Scott McGough for the lowest mark on the team among D-backs relievers who have inherited 15 or more baserunners this year.
The league average inherited score percentage in 2023 is 32 percent.
Other top choice: Walks
“I try to limit my walks as much as I can,” Mantiply said. “If get beat getting hit, then I can live with that.”
Mantiply has walked just 14 batters in 95.1 innings of work over the past two seasons. That works out to 1.3 walks per nine, which is tied for fourth-lowest in baseball among pitchers with 80 or more innings in that timeframe.

Bryce Jarvis
Quality starts and wins
Bryce Jarvis has worked as a reliever this year for the Diamondbacks, but he has spent effectively all of his minor league career as a starter. In that role, quality starts and wins are his top choices.
“I know a lot of people don’t put a lot of stock in wins,” he said, “but quality starts, wins, those mean a lot to me personally as a starter just because it means you’re doing your job. You’re putting your team in a chance to win.”
Other top choice: WHIP
When pitching out of the bullpen, Jarvis shifts his focus to WHIP.
“These last couple weeks as a reliever,” he said, “I’ve looked at WHIP a little bit more, trying to get quick outs and keep the traffic off the bases. You want those back-half innings to be quick and painless for everyone watching, especially the starter who just handed the game over to you [and] the coaches who are trying to decide how long to leave you in.”
Jarvis is only 18 innings into his big league career, but his 0.94 WHIP to date is impressive.
Top photo: Matt Kartozian/USA TODAY Sports
Get Arizona's Best Sports Content In Your Inbox!Become a smarter Arizona sports fan with the latest game recaps, analysis and exclusive content from PHNX's writers and podcasters!
Just drop your email below!
Comments
Share your thoughts
Join the conversation


